Trove Database as a Service for Openstack

Trove is Database as a Service for OpenStack. It’s designed to run entirely on OpenStack, with the goal of allowing users to quickly and easily utilize the features of a relational or non-relational database without the burden of handling complex administrative tasks. Cloud users and database administrators can provision and manage multiple database instances as needed. Initially, the service will focus on providing resource isolation at high performance while automating complex administrative tasks including deployment, configuration, patching, backups, restores, and monitoring.

Scope

  • Setup Networking for Trove
  • Deploy Trove Service
  • Create Trove mgmt network
  • Upload DB (mysql) Image.
  • Create datastor and version
  • Create database instance
  • Test & Validation
  • Database operations

Notes: I’m running kolla-ansible (2023.1). Adjust some configuration according your deployment tools.

Setup network for Trove

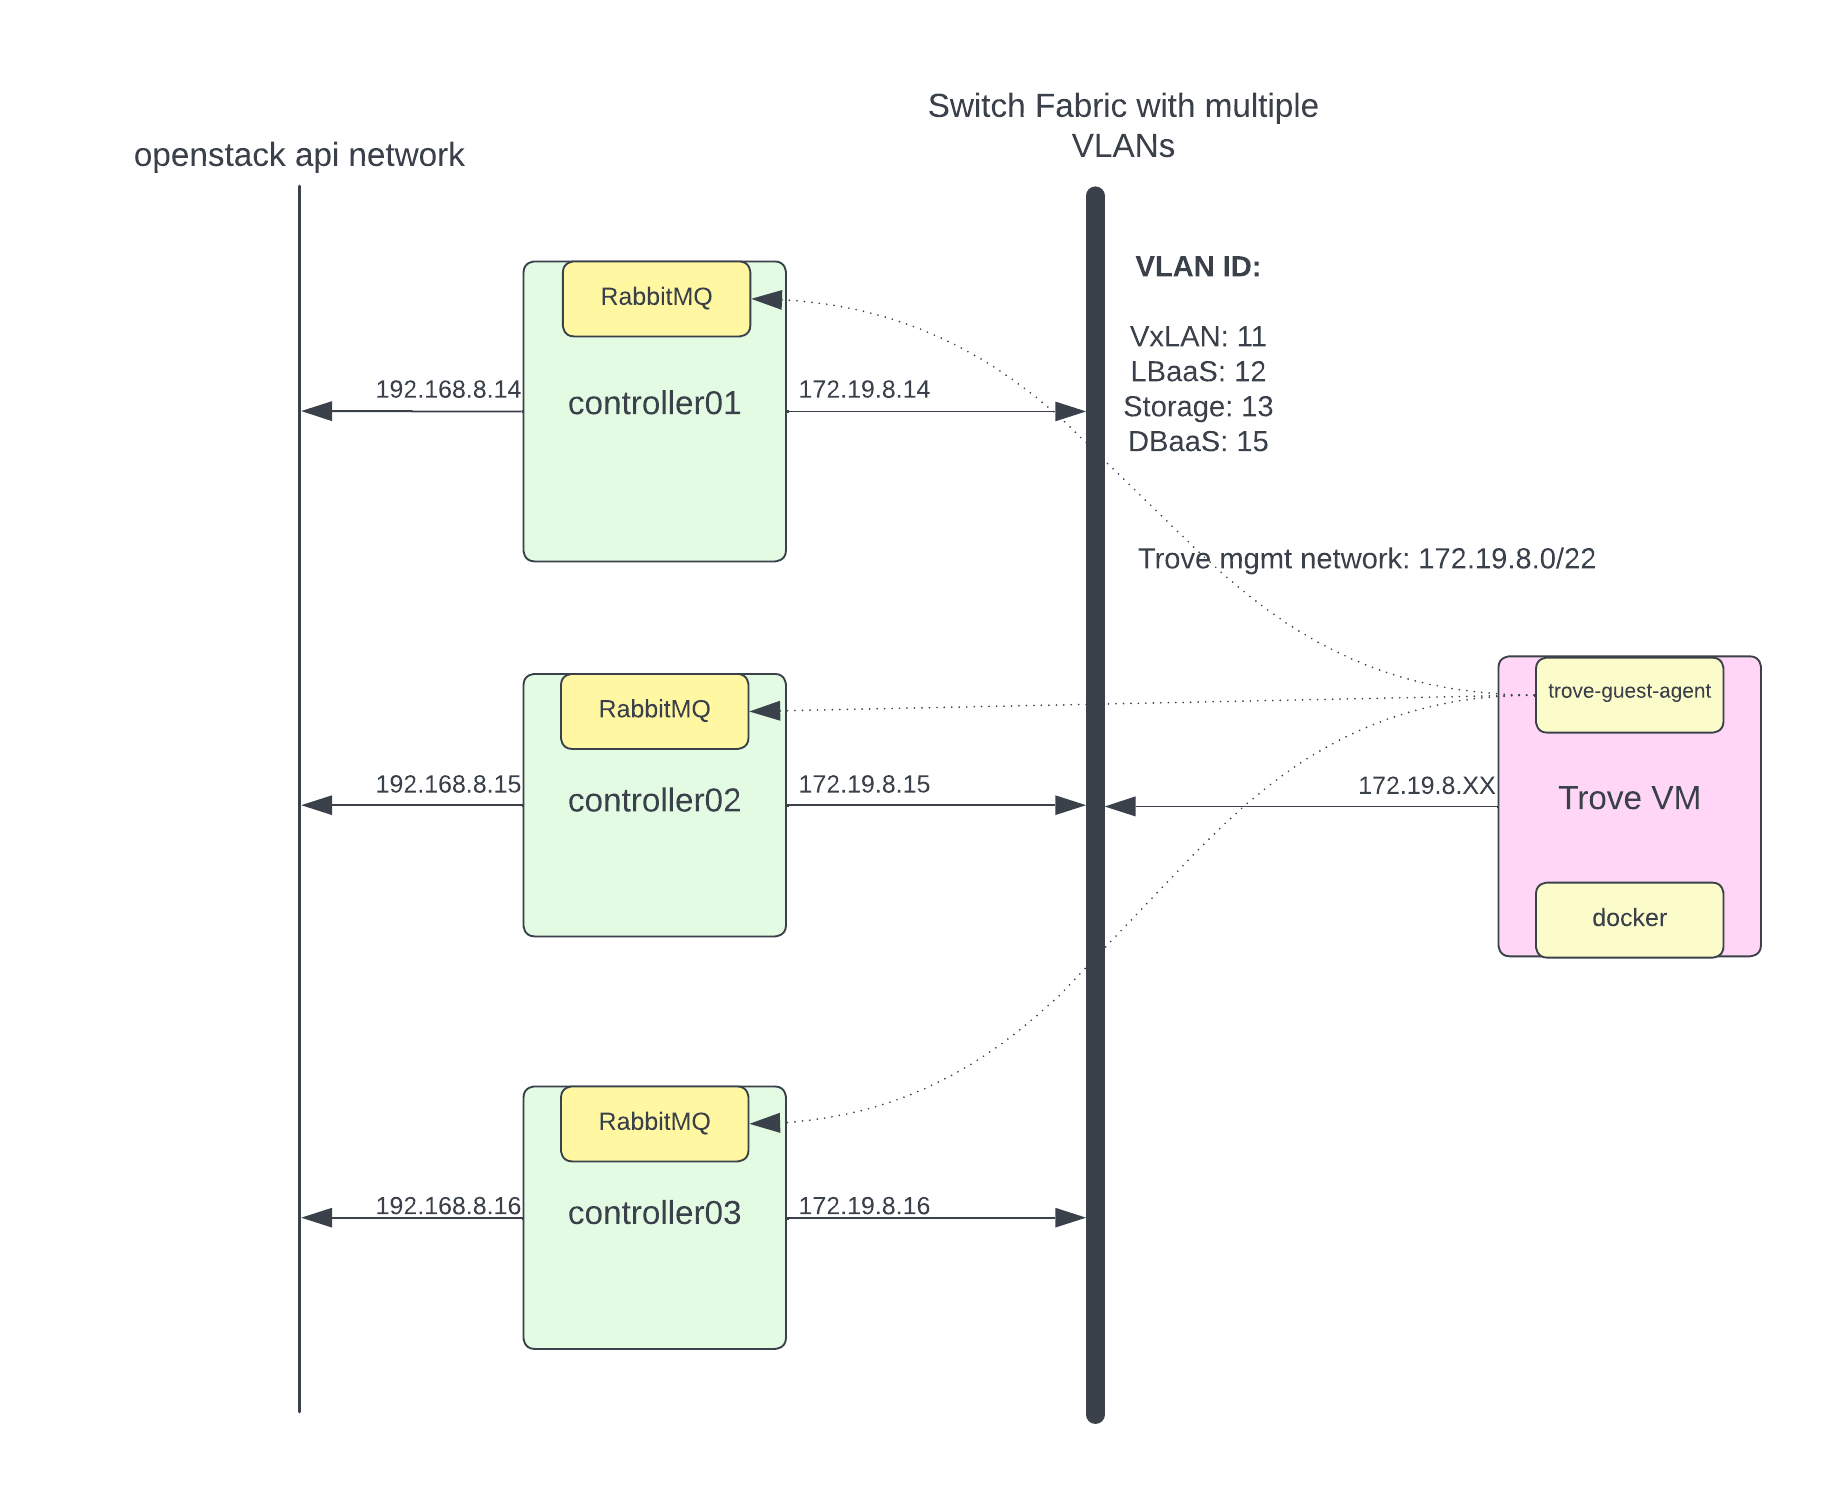
Trove has a very strange requirement where Trove talks to the instances via RabbitMQ using a common set of commands, which are translated into database server specific commands by the Trove guest-agent running on the instance. This is the biggest security concern because some Trove instance run on public IP and there is a possibility of privilege escalation to gain access to RabbitMQ. Here I am not going into that security discussion to architure. May be in next blog I will try to re-architecture to address security concern.

I have created dedicated VLAN for DBaaS for trove mgmt network. Trove DB instance (trove-guest-agent) will use this VLAN to talk to rabbitMQ. I’ll configure DBaaS VLAN and assign IP address to only openstack controller nodes. Following is my netplan configuration to get some idea.

output omitted...

# VxLAN for 10G Bond
    bond10.11:
      id: 11
      link: bond10
      dhcp4: false
      dhcp6: false
      mtu: 9000
      addresses: [ 172.16.8.14/22 ]
    # LBaaS (Octivia)
    bond10.12:
      id: 12
      link: bond10
      dhcp4: false
      dhcp6: false
      mtu: 1500
      addresses: [ 172.17.8.14/22 ]
    # DBaaS (Trove)
    bond10.15:
      id: 15
      link: bond10
      dhcp4: false
      dhcp6: false
      mtu: 1500
      addresses: [ 172.19.8.14/22 ]

I have openstack network api network running on different interface and trove-mgmt-net running on different network. (To fix routing for trove guest agent to talk to rabbitMQ I’ve used host routes in trove-mgmt-net. you will see example in configuration section.)

<img>

Deploy Trove Service

I am running kolla-ansible (2023.1 release). Possible this step is differ in your deployment environment.

In /etc/kolla/globals.yml

enable_trove: "yes"

Run kolla-ansible to deploy.

$ kolla-ansible -t multinode deploy -t trove,common,horizon

Configure Trove Service

NOTES : This patch https://review.opendev.org/c/openstack/kolla-ansible/+/863321/13still under pending review and because of that I have to create trove-mgmt-network and security group by hand.

Create trove mgmt network and subnet.

$ openstack network create --provider-physical-network physnet1 --provider-network-type vlan --provider-segment 15 trove-mgmt-net
$ openstack subnet create --subnet-range 172.19.8.0/22 --allocation-pool start=172.19.8.50,end=172.19.8.254 --network trove-mgmt-net trove-mgmt-subnet

NOTE: I have added host specific route in trove-mgmt-subnet because based on my network topology, because my openstack api network running on different network interface on openstack controller nodes.

$ openstack subnet show trove-mgmt-subnet
+----------------------+------------------------------------------------------+
| Field                | Value                                                |
+----------------------+------------------------------------------------------+
| allocation_pools     | 172.19.8.50-172.19.8.254                             |
| cidr                 | 172.19.8.0/22                                        |
| created_at           | 2024-01-25T03:11:04Z                                 |
| description          |                                                      |
| dns_nameservers      |                                                      |
| dns_publish_fixed_ip | None                                                 |
| enable_dhcp          | True                                                 |
| gateway_ip           | None                                                 |
| host_routes          | destination='192.168.8.14/32', gateway='172.19.8.14' |
|                      | destination='192.168.8.15/32', gateway='172.19.8.15' |
|                      | destination='192.168.8.16/32', gateway='172.19.8.16' |
output omitted...

Create security group trove-sec-grp and allow ICMP and SSH ports and create ssh-key pair to access trove instance during troubleshooting. (You are going to create security-group and key inside trove service project. I mostly do this from Horizon GUI because its much easier).

Next configure trove to use trove network/security-group & key. Create followig file in kolla to push out changes.

/etc/kolla/config/trove.conf

[DEFAULT]
management_networks = ee2a2a81-178c-4d79-867b-8baf53ec236d
nova_keypair = trove-ssh-key
management_security_groups = 451e4b4a-58b4-4e9f-84a8-5bdb21e34cd5

/etc/kolla/config/trove-guestagent.conf

[DEFAULT]
transport_url = rabbit://openstack:<RABBITMQ_PASSWORD>@192.168.8.14:5672,openstack:<RABBITMQ_PASSWORD>@192.168.8.15:5672,openstack:<RABBITMQ_PASSWORD>@192.168.8.16:5672//
control_exchange = trove
root_grant = ALL
root_grant_option = True
debug = False

[oslo_messaging_rabbit]
heartbeat_in_pthread = false
amqp_durable_queues = true
rabbit_quorum_queue = true

NOTES: I have created trove-guestagent.conf file to override my changes like RabbitMQ IP. 192.168.8.X is my openstack API network where rabbitMQ running.

Deploy changes.

$ kolla-ansible -i multinode reconfigure -t trove

Deploy Trove Image & Datastore version

Download trove image for testing. (For production you should build your own image)

$ wget https://tarballs.opendev.org/openstack/trove/images/trove-master-guest-ubuntu-jammy.qcow2

Upload image in glance, the image is assigned tags that will be used when creating datastore version.

$ openstack image create Trove-Ubuntu --disk-format qcow2 --container-format bare --public --tag trove --file trove-master-guest-ubuntu-jammy.qcow2

Create database version. You need to create at least one datastore version for each type of database supported. This example creates a datastore version for MySQL 5.7.29:

$ openstack datastore version create 5.7.29 mysql mysql "" --image-tags trove,mysql --active --default --version-number 5.7.29

Verify datastore version.

$ openstack datastore version list mysql
+--------------------------------------+--------+---------+
| ID                                   | Name   | Version |
+--------------------------------------+--------+---------+
| 0b218550-a28c-4cb7-b907-ecac89a27b5f | 5.7.29 | 5.7.29  |
+--------------------------------------+--------+---------+

Validation and Testing

Create mysql database instance. (–is-public will assign public network for outside world access)

$ openstack database instance create my_db \
    --flavor m1.medium \
    --size 10 \
    --nic net-id=81ce26ec-1151-4960-b3ca-bf529e6296b2 \
     --database testdb \
     --users spatel:mypassword \
     --datastore mysql \
     --datastore-version 5.7.29 \
     --is-public \
     --allowed-cidr 0.0.0.0/0

Check status of database instance. Voila!!

$ openstack database instance list
+--------------------------------------+-------+-----------+-------------------+--------+------------------+--------+----------------------------------------------------------------------------------+-----------+------+------+
| ID                                   | Name  | Datastore | Datastore Version | Status | Operating Status | Public | Addresses                                                                        | Flavor ID | Size | Role |
+--------------------------------------+-------+-----------+-------------------+--------+------------------+--------+----------------------------------------------------------------------------------+-----------+------+------+
| 95949d3e-2478-435f-b178-b5224854434d | my_db | mysql     | 5.7.29            | ACTIVE | HEALTHY          | True   | [{'address': '10.0.0.205', 'type': 'private', 'network':                         | 3         |   10 |      |
|                                      |       |           |                   |        |                  |        | '81ce26ec-1151-4960-b3ca-bf529e6296b2'}, {'address': '202.202.202.202', 'type':  |           |      |      |
|                                      |       |           |                   |        |                  |        | 'public'}]                                                                       |           |      |      |
+--------------------------------------+-------+-----------+-------------------+--------+------------------+--------+----------------------------------------------------------------------------------+-----------+------+------+

Let’s access it from public network and verify database.

$ mysql -h 202.202.202.202 -u spatel -p
Enter password:
Welcome to the MariaDB monitor.  Commands end with ; or \g.
Your MySQL connection id is 20
Server version: 5.7.29 MySQL Community Server (GPL)

Copyright (c) 2000, 2018, Oracle, MariaDB Corporation Ab and others.

Type 'help;' or '\h' for help. Type '\c' to clear the current input statement.

MySQL [(none)]> show databases;
+--------------------+
| Database           |
+--------------------+
| information_schema |
| testdb             |
+--------------------+
2 rows in set (0.14 sec)

MySQL [(none)]>

Database operations & User management using Trove API

You can list database users.

$ openstack database user list my_db
+--------+------+-----------+
| Name   | Host | Databases |
+--------+------+-----------+
| spatel | %    | testdb    |
+--------+------+-----------+

Create new user for testdb.

$ openstack database user create my_db newuser userpass --databases testdb
$ openstack database user list my_db
+---------+------+-----------+
| Name    | Host | Databases |
+---------+------+-----------+
| newuser | %    | testdb    |
| spatel  | %    | testdb    |
+---------+------+-----------+

Create new database.

$ openstack database db create my_db newdb
$ openstack database db list my_db
+--------+
| Name   |
+--------+
| newdb  |
| testdb |
+--------+

Manage access to databases using trove api.

$ openstack database user grant access my_db newuser newdb
$ openstack database user show access my_db newuser
+--------+
| Name   |
+--------+
| newdb  |
| testdb |
+--------+

Troubleshooting

Sometime you would like to get on vm instance to check logs of trove-guest-agent or docker container etc.

First find out VM instance IP address of trove-mgmt-network where your DB running.

$ openstack server list --project service --name my_db
+--------------------------------------+-------+--------+-------------------------------------------------------------------+--------------+-----------+
| ID                                   | Name  | Status | Networks                                                          | Image        | Flavor    |
+--------------------------------------+-------+--------+-------------------------------------------------------------------+--------------+-----------+
| 5e60e685-14a9-4e23-9aaa-7dd5aa82cfd9 | my_db | ACTIVE | demo-net=10.0.0.205, 202.202.202.202; trove-mgmt-net=172.19.8.172 | Trove-Ubuntu | m1.medium |
+--------------------------------------+-------+--------+-------------------------------------------------------------------+--------------+-----------+

SSH to 172.19.8.172 from controller node because it has IP address of that subnet. (make sure you are using right ssh-key for instance)

$ ssh 172.19.8.172 -l ubuntu
ubuntu@my-db:~$ sudo su -
root@my-db:~#

Check logs of trove agent.

$ journalctl -u guest-agent.service -f

Check docker and logs because mysql database running inside docker container.

$ docker ps
CONTAINER ID   IMAGE          COMMAND                  CREATED          STATUS          PORTS                                                  NAMES
3a98e2a23396   mysql:5.7.29   "docker-entrypoint.s…"   36 minutes ago   Up 36 minutes   0.0.0.0:3306->3306/tcp, :::3306->3306/tcp, 33060/tcp   database

Check docker logs of database container.

$ docker logs database

Enjoy!!!

How to create custom indices based on Kubernetes metadata using fluentd?


How to create custom indices based on Kubernetes metadata using fluentd?

In the previous articles, we learned about setting Fluentd on Kubernetes with the default setup config. Now in this article, we will learn how to create custom indices using Fluentd based on Kubernetes metadata and tweaking an EFK stack on Kubernetes.

Here, I will be using the Kubernetes metadata plugin to add metadata to the log. This plugin is already installed in the Docker image (fluent/fluentd-kubernetes-daemonset:v1.1-debian-elasticsearch), or you can install it using “gem install fluent-plugin-kubernetes_metadata_filter” into your Fluent docker file. Use the filter in Fluentd config value to add metadata to the log.

# we use kubernetes metadata plugin to add metadatas to the log
<filter kubernetes.**>
@type kubernetes_metadata
</filter>

Here, our source part is the same as we used in setting Fluentd on Kubernetes with the default setup configI will customize the matching part in the default config and create a custom index using Kubernetes metadata. So here we are creating an index based on pod name metadata. The required changes are below into the matching part:

# we send the logs to Elasticsearch
<match kubernetes.**>
@type elasticsearch_dynamic
@log_level info
include_tag_key true
host "#{ENV['FLUENT_ELASTICSEARCH_HOST']}"
port "#{ENV['FLUENT_ELASTICSEARCH_PORT']}"
user "#{ENV['FLUENT_ELASTICSEARCH_USER']}"
password "#{ENV['FLUENT_ELASTICSEARCH_PASSWORD']}"
scheme "#{ENV['FLUENT_ELASTICSEARCH_SCHEME'] || 'http'}"
ssl_verify "#{ENV['FLUENT_ELASTICSEARCH_SSL_VERIFY'] || 'true'}"
reload_connections true
logstash_format true
logstash_prefix ${record['kubernetes']['pod_name']}
<buffer>
@type file
path /var/log/fluentd-buffers/kubernetes.system.buffer
flush_mode interval
retry_type exponential_backoff
flush_thread_count 2
flush_interval 5s
retry_forever true
retry_max_interval 30
chunk_limit_size 2M
queue_limit_length 32
overflow_action block
</buffer>
</match>

I will use Kubernetes metadata in logstash_prefix “${record[‘kubernetes’][‘pod_name’]}” to create an index with the pod name. You can also create an index with any Kubernetes metadata ( like namespace & deployment ). And here, you can tweak some configuration for logging data to ES as per your need. Suppose I don’t want to send some unwanted logs to ES like Fluentd, Kube-system or other namespace containers’ logs, so you can add these lines before the Elasticsearch output:

    <match kubernetes.var.log.containers.**kube-logging**.log>
@type null
</match>
<match kubernetes.var.log.containers.**kube-system**.log>
@type null
</match>
<match kubernetes.var.log.containers.**monitoring**.log>
@type null
</match>
<match kubernetes.var.log.containers.**infra**.log>
@type null
</match>

Here, we have the final Kube-manifest config map, we just need to run it and apply the changes to the k8s cluster and rolling deploy the existing Fluentd.


apiVersion: v1
kind: ConfigMap
metadata:
  name: fluentd-config
  namespace: infra
data:
  fluent.conf: |
    <match fluent.**>
        # this tells fluentd to not output its log on stdout
        @type null
    </match>

    # here we read the logs from Docker's containers and parse them
    <source>
      @type tail
      path /var/log/containers/*.log
      pos_file /var/log/containers.log.pos
      tag kubernetes.*
      read_from_head true
      <parse>
        @type json
        time_format %Y-%m-%dT%H:%M:%S.%NZ
      </parse>
    </source>

    # we use kubernetes metadata plugin to add metadatas to the log
    <filter kubernetes.**>
        @type kubernetes_metadata
    </filter>

    <match kubernetes.var.log.containers.**kube-logging**.log>
    @type null
    </match>

    <match kubernetes.var.log.containers.**kube-system**.log>
    @type null
    </match>

    <match kubernetes.var.log.containers.**monitoring**.log>
    @type null
    </match>

    <match kubernetes.var.log.containers.**infra**.log>
    @type null
    </match>


     # we send the logs to Elasticsearch
    <match kubernetes.**>
       @type elasticsearch_dynamic
       @log_level info
       include_tag_key true
       host "#{ENV['FLUENT_ELASTICSEARCH_HOST']}"
       port "#{ENV['FLUENT_ELASTICSEARCH_PORT']}"
       user "#{ENV['FLUENT_ELASTICSEARCH_USER']}"
       password "#{ENV['FLUENT_ELASTICSEARCH_PASSWORD']}"
       scheme "#{ENV['FLUENT_ELASTICSEARCH_SCHEME'] || 'http'}"
       ssl_verify "#{ENV['FLUENT_ELASTICSEARCH_SSL_VERIFY'] || 'true'}"
       reload_connections true
       logstash_format true
       logstash_prefix ${record['kubernetes']['pod_name']}
       <buffer>
           @type file
           path /var/log/fluentd-buffers/kubernetes.system.buffer
           flush_mode interval
           retry_type exponential_backoff
           flush_thread_count 2
           flush_interval 5s
           retry_forever true
           retry_max_interval 30
           chunk_limit_size 2M
           queue_limit_length 32
           overflow_action block
       </buffer>
    </match>
$ kubectl apply -f fluentd-config-map-custome-index.yaml

After applying the changes, now we have indices with pod names which can be seen in ES and Kibana.

I hope this blog was useful to you. Looking forward to claps and suggestions. For any queries, feel free to comment.


Windows 2012/Windows 2012R2 - RDP lagująca myszka

Q: Jeśli podczas połączenia RDP laguje Ci myszka w oknie zdalnego pulpitu.
A: Wyłącz cień dla kursora :)


Windows 10 BSOD with video_tdr_failure igdkmd64.sys

That "igdkmd64.sys" is related to Intel HD Graphics 4600 Kernel Mode Driver. For me it looks like "igdkmd64.sys" file is corrupted. So I have tried below options,

1. Uninstall the Intel HD Graphics Drivers and reboot PC
2. Open Device Manager and navigate to Display Adapters-> Intel Graphics (right click) -> Disable.


After PC reboot you will not get any BSOD with video_tdr_failure.

Błąd 0x00000709 podczas wyboru drukarki na domyślną.

Jak Rozwiązać Problem:
należy zmienić uprawnienia wpisu w rejestrze dotyczącego drukarki domyślnej

w jaki sposób:

wpisujemy w pasku menu start regedit i przyznajemy akcji uprawnienia Admina.

odszukujemy :

HKEY_CURRENT_USER\Software\Microsoft\Windows NT\CurrentVersion\Windows

i prawym przyciskiem myszki na powyższym Kluczu (który przypomina katalog) wybieramy  uprawnienia.


nadajemy bieżącemu użytkownikowi i administratorowi i pewnie systemowi pełną kontrolę


następnie w:

HKEY_CURRENT_USER\Software\Microsoft\Windows NT\CurrentVersion\Windows

usuwamy wartość podklucza device (w sensie nie cały podklucz tylko wartość przypisaną)


oraz jeśli występuje jakaś ścieżka do sterownika poniżej to też usuwamy wartość przypisaną.

Zapisujemy i resetujemy.

Następnie Wybieramy w drukarkach domyślną drukarkę. (tym razem bez błędu)

U mnie Działa...

Pozdrawiam mam nadzieje, że komuś się przyda. Jeśli tak proszę o komentarz.

VMware 5.5 - Windows Server 2012R2 losing network

If you use network card: e1000 or e1000e

You must install update:

Better options change NIC to: VMXNET3 (better and faster)
If you change NIC to VMXNET3, must install VMware tools (driver to NIC)


HP ProCurve - switch update firmware

swx# show version
Image stamp:    /sw/pre/build/nemo(ndx)
                Jan 25 2008 13:54:14
                R.11.07
                104
Boot Image:     Primary
BL-C234-AS01# show flash
Image           Size(Bytes)   Date   Version
-----           ----------  -------- -------
Primary Image   : 3689315   01/25/08 R.11.07
Secondary Image : 3689315   01/25/08 R.11.07
Boot Rom Version: R.10.06
Current Boot    : Primary
We see that’s we’re running firmware version R.11.07. When copying the firmware to my TFTP server, I’ll use the same filename convention that HP does, so our filename will be R\_11\_07.swi. Let’s save a copy to the TFTP server:
swx# copy flash tftp 192.168.1.12 R_11_07.swi
I always like to verify that the file actually shows up on the TFTP server, regardless of any error messages (or lack thereof) from the switch:
$ ls -l /tftpboot/R_11_07.swi
-rw-r--r-- 1 nobody nogroup 3689315 2009-02-02 23:28 /tftpboot/R_11_07.swi
In the meantime, I’ve downloaded the latest version of the software, R.11.25, from HP’s FTP server and saved it as R\_11\_25.swi on the TFTP server. Let’s go ahead and copy it over to the primary flash on the switch:
swx# copy tftp flash 192.168.1.12 R_11_25.swi primary
The Primary OS Image will be deleted, continue [y/n]?  y
Here we tell the switch to copy from a TFTP server to flash memory, the TFTP server has IP address 192.168.1.12, the filename on the TFTP server is R\_11\_25.swi, and that we want that file saved to the primary flash on the switch. You’ll see a progress counter as the file is transferred, then:
Validating and Writing System Software to FLASH...
which takes a moment. After it has completed, we can verify success by examining the contents of flash:
swx# show flash
Image           Size(Bytes)   Date   Version
-----           ----------  -------- -------
Primary Image   : 3790986   01/14/09 R.11.25
Secondary Image : 3689315   01/25/08 R.11.07
Boot Rom Version: R.10.06
Current Boot    : Primary
We can now reboot the switch with the new firmware:
swx# reload
Device will be rebooted, do you want to continue [y/n]?  y
After the switch boots back up, we can verify that it is running the latest firmware:
swx# show version
Image stamp:    /sw/pre/build/nemo(ndx)
                Jan 14 2009 15:31:02
                R.11.25
                301
Boot Image:     Primary
HINT: Always read the release notes before upgrading firmware, especially on a production device!

LinkWithin-4

Related Posts Plugin for WordPress, Blogger...